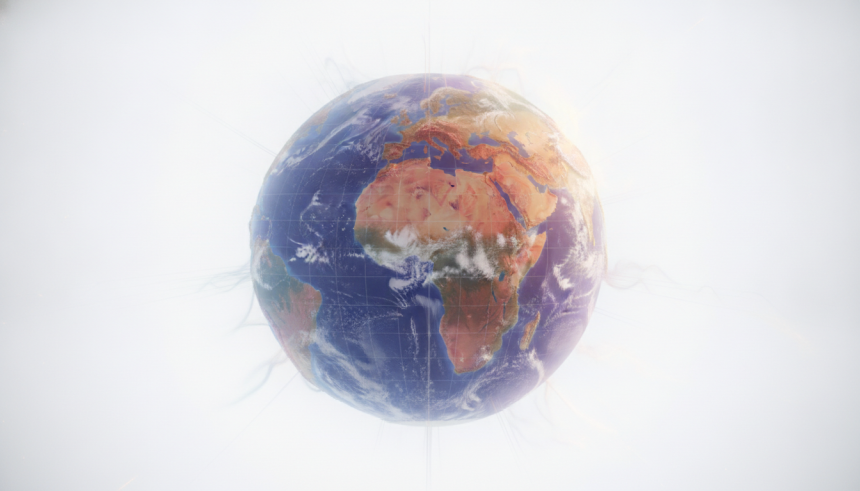
Scientists say Earth is not the smooth sphere people imagine. New gravity maps show a lumpy, shifting planet that changes with water, ice, and rock movement. The work draws on satellite data and decades of measurements to explain why gravity varies by place and time.
Researchers use these maps to track melting ice sheets, rising seas, and the flow of groundwater. The insights help cities, farmers, and emergency planners prepare for a warming world. They also refine navigation and improve satellite orbits.
“We like to think of our home as a nice, smooth sphere. But mapping the Earth’s gravitational field provides a different view of the planet.”
Why Gravity Mapping Matters
Gravity is stronger where dense rock piles up and weaker where mass is missing. The pattern forms a surface called the geoid. The geoid guides ocean circulation and affects sea level from place to place.
Past maps were coarse and slow to update. Satellite missions changed that. The GRACE and GRACE-FO satellites measure tiny changes in distance as they fly over mass shifts. The GOCE mission sharpened the picture of Earth’s gravity at shorter scales.
Together, these missions show how ice in Greenland and Antarctica has thinned over the last two decades. They also detect how drought lowers groundwater in regions from California to the Middle East.
How Scientists Build the Map
Satellites sense gravity by tracking subtle changes in motion. Lasers or microwaves measure the spacing between paired spacecraft to a fraction of a human hair. When they pass over a mass excess, the lead satellite speeds up slightly. The change reveals the hidden structure below.
Teams merge satellite data with ground and ocean measurements. They correct for tides, air pressure, and temperature. The result is a time series that shows where mass is moving each month.
- GRACE began in 2002 and continued until 2017.
- GRACE-FO has tracked changes since 2018.
- GOCE improved global gravity details until 2013.
What the Findings Show
Greenland has lost billions of tons of ice each year since the early 2000s. This loss raises sea levels and alters regional gravity. Antarctica shows a split story. East Antarctica appears more stable, while West Antarctica has seen faster loss.
In the tropics and mid-latitudes, groundwater is falling in many farming areas. Satellite gravity shows declines where pumping exceeds recharge. Recovery is slow when rains return, since aquifers fill over years, not weeks.
Mountains and ocean ridges also stand out in the gravity signal. Dense rock roots below the Himalayas and Andes leave a clear mark. Under the oceans, mid-ocean ridges and trenches shape currents and sea surface height.
Impacts on Society and Industry
Accurate gravity maps guide sea level planning. Local sea level can differ by tens of centimeters due to ocean mass and wind patterns. Planners use gravity-based models to set flood defenses and zoning rules.
Energy firms and geologists use gravity data to study sediment basins and tectonic stress. While gravity alone does not locate resources, it narrows targets when paired with other surveys.
Navigation improves too. A better geoid sharpens GPS height measurements. Engineers need precise elevations for bridges, levees, and rail lines.
Checks, Caveats, and Debate
Gravity data can be ambiguous. A mass change could be ice loss, soil drying, or groundwater pumping. Analysts combine gravity with altimetry, InSAR, and field checks to separate these signals.
There is debate on how fast certain glaciers will retreat. Some models warn of rapid loss if warm water reaches ice shelves. Others point to local conditions that slow change.
Still, trends are clear in many places. Long records show steady ice loss and persistent groundwater decline in key basins.
What Comes Next
Future satellites will track gravity more often and with finer detail. New laser ranging and drag control could sharpen monthly maps. Ties to ocean and land models will improve forecasts of sea level and drought.
Agencies plan to release open data and tools for local users. Cities and water managers will be able to test scenarios faster and with more confidence.
As one scientist said, gravity maps give a fresh view of a living planet. They reveal where mass is moving today and hint at what may shift tomorrow.
The key takeaway is practical. Gravity mapping turns invisible change into usable information. Watch for updates from GRACE-FO and its successors. Expect closer tracking of ice sheets, groundwater, and sea level that will shape planning in the years ahead.