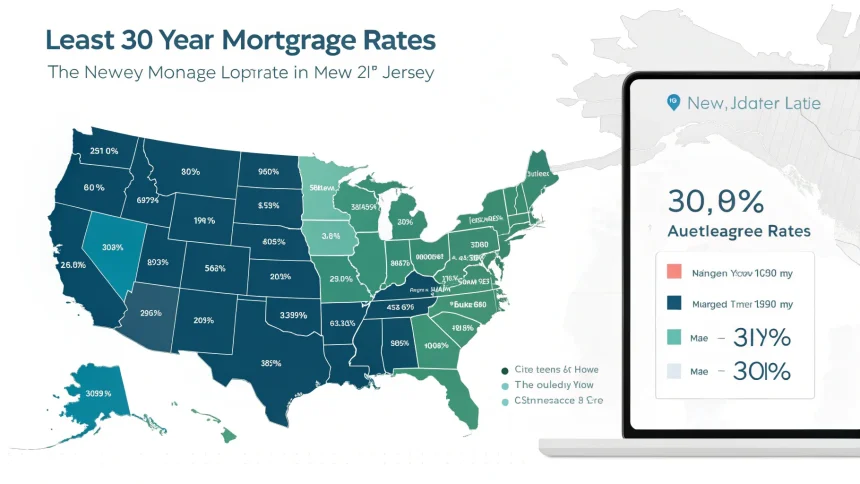
A new interactive mortgage rate tool reveals that New Jersey and New York currently offer the lowest 30-year mortgage rates in the United States. The online map allows potential homebuyers to compare average mortgage rates across all 50 states with a simple click.
The tool comes at a critical time for the housing market, as mortgage rates have experienced significant fluctuations over the past year. By providing state-specific data, the map helps homebuyers make more informed decisions about where and when to purchase property.
Regional Rate Disparities
The Northeast appears to be leading the nation in competitive mortgage rates, with New Jersey and New York standing out as the most affordable states for 30-year fixed-rate mortgages. This regional advantage could potentially attract homebuyers to these markets despite their typically higher home prices.
Financial analysts point out that several factors contribute to these state-by-state differences, including:
- Local economic conditions
- State-level banking regulations
- Competition among lenders in different regions
- Regional housing demand
“The difference between the highest and lowest state rates can translate to thousands of dollars over the life of a loan,” notes a housing economist familiar with the data. “For a $300,000 mortgage, even a quarter-point difference adds up to significant savings.”
How Homebuyers Can Use This Information
The interactive map serves as more than just a curiosity—it provides actionable intelligence for various stakeholders in the housing market. Prospective homebuyers can use the tool to compare rates not only in their current location but also in areas where they might consider relocating.
Real estate professionals suggest that the map could influence buying decisions, especially for remote workers with geographic flexibility. “With more people able to work from anywhere, we’re seeing clients factor mortgage rates into their relocation decisions,” says a real estate agent who has observed this trend.
The tool also allows users to track historical rate trends by state, helping buyers time their purchases more strategically. This feature proves particularly valuable in today’s volatile interest rate environment.
The Broader Market Context
The availability of this state-specific mortgage data comes as the housing market continues to adjust to higher interest rates compared to the record lows seen in 2020-2021. National average rates for 30-year fixed mortgages have more than doubled from their pandemic lows.
Housing market analysts suggest that these regional differences might persist or even widen as the Federal Reserve continues its efforts to control inflation. The state-by-state variations reflect how national monetary policy can have uneven impacts across different regional economies.
For those considering a home purchase, the message is clear: location matters not just for the property itself, but for the financing terms available. The difference between securing a mortgage in New Jersey versus a higher-rate state could significantly impact monthly payments and total interest paid over three decades.
The interactive map represents a step forward in mortgage rate transparency, giving consumers more power to compare options across state lines. As rate environments continue to evolve, such tools may become increasingly valuable for navigating the complex landscape of home financing.


