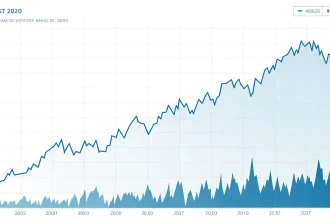
US-listed exchange-traded funds rebounded in August, defying the month’s historical average and keeping year-to-date inflows above $1.4 trillion, according to State Street data.
The recovery suggests investors continued directing substantial capital into ETFs despite August’s weaker seasonal record. The total also shows sustained demand for funds that trade on exchanges and track baskets of securities.
August Breaks With Historical Pattern
August has historically produced a lower average for ETF flows. This year’s rebound broke that pattern, giving the fund market fresh momentum during a month often associated with lighter trading.
US-listed ETFs “rebounded in August, shattering the month’s historical average,” according to State Street’s findings.
The result matters because monthly flows offer a timely measure of investor behavior. Inflows mean more money entered ETFs than left them during the measured period.
However, flow totals do not show whether investors were optimistic across every market. Money can enter stock, bond, commodity, or defensive funds for very different reasons.
Annual Inflows Stay Above $1.4 Trillion
Year-to-date inflows remained above $1.4 trillion after August’s advance. That figure points to strong ETF demand across the US-listed market.
ETFs have gained broad use because they can offer diversified exposure through a single trade. Many also provide transparent holdings and lower costs than some traditional investment products.
The reported results highlight two key developments:
- August ETF flows exceeded the month’s historical average.
- Annual inflows stayed above the $1.4 trillion threshold.
The scale of the yearly total may also reflect how investors use ETFs for more than long-term savings. Financial advisers, institutions, and individual traders can use them to adjust portfolios quickly.
What the Rebound Does Not Reveal
The headline total gives a broad view, but it does not identify which categories attracted the most money. That detail would help show whether investors favored shares, bonds, cash-like products, or specialized strategies.
Strong inflows also should not be treated as a direct forecast for asset prices. ETF purchases can reflect portfolio rebalancing, tax planning, hedging, or transfers from other investment vehicles.
Outflows from mutual funds may sometimes accompany ETF inflows, for example. In that case, the movement could represent a change in product preference rather than entirely new investment.
Industry Momentum Faces Further Tests
Future reports will show whether August marked a short-term bounce or part of a longer growth trend. Investors will be watching monthly flows, market returns, interest-rate expectations, and shifts among major asset classes.
Fund issuers may view the rebound as evidence that demand remains firm. Yet competition for investor assets is likely to keep pressure on fees and product design.
For now, State Street’s data presents a clear result: US-listed ETFs outperformed their usual August flow pattern and preserved a year-to-date total above $1.4 trillion. The next test is whether that pace continues through the remaining months of the year.